


How do I collect data from the U.S. Climate Vulnerability Index?
Learn more about how to generate effective reports and use the CVI for grant applications in this section.
- Download this PowerPoint template to follow along. If you do not have PowerPoint or Keynote, follow these instructions to use this template in Google Slides.
- Download this reference worksheet for more help
- Download the CVI Indicator Justice40 table
CVI Grant Funding Overview
The CVI contains two pieces of information that that make it stand out from other environmental justice screening and mapping tools.
- How a community vulnerability ranks compared to other locations
- What is driving vulnerability at a particular location
Both pieces of information should be highlighted to make the strongest case for addressing vulnerabilities in a community, either in a grant application or to elected officials. Including visuals and reports from this tool in grant applications translates lived reality into data and can be pivotal in securing grant funding.
How to use the CVI for grant applications
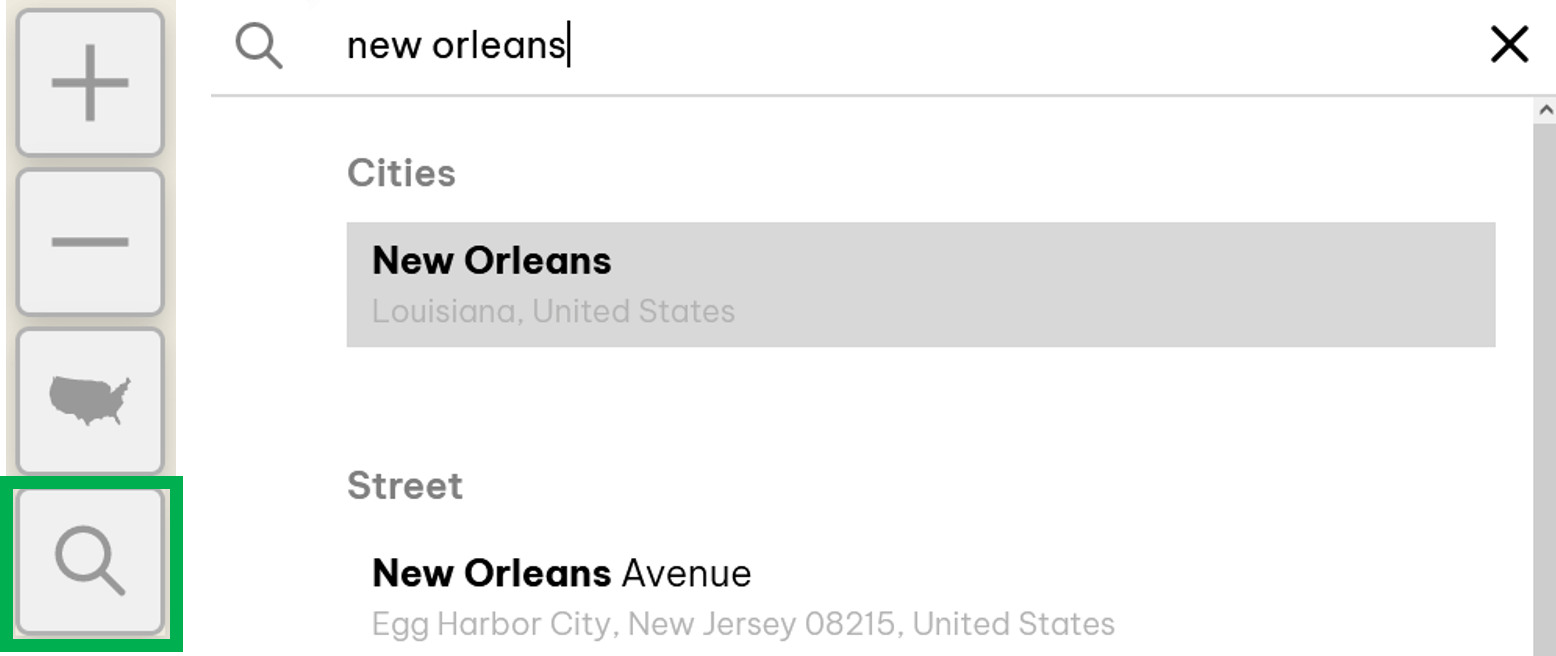
Step 1: Pick a location
Enter an address, street, neighborhood, zip code, city, or county in the search bar to find your community. You can also locate your state or EPA Region in the Geographic Context.
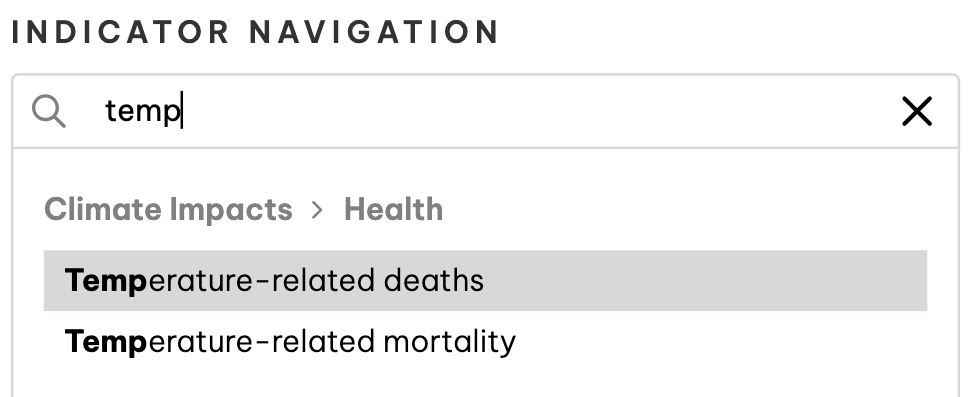
Step 2: Select or search for an indicator
Find an indicator(s) you would like to use in your grant funding application by searching for it in the “Indicator Navigation” search box or clicking in the square navigation tree.

Step 3: Export images
Find “Export Image” in the lower left corner. This will export the map image for use in grant applications.
Learn more about Justice40 and other grant funding opportunities in the Resources section of this website.
Justice40, Community Advocacy, and CVI
More specific CVI data is needed to target most grant funding, including Justice40 and advocacy beyond the overall community level. Knowing where the greatest drivers of vulnerability in a community exist can be used as a starting point to find dedicated funding or programs from Justice40 initiatives to make meaningful and lasting progress on reducing inequalities and remediating injustices. You can find more information about Justice40 here.
Justice40 Funding Opportunities
Learn more about President Biden’s Justice40 Initiative, which aims to direct at least 40% of his administration’s climate and infrastructure investment benefits to disadvantaged communities.

Climate Change

Clean Energy & Energy Efficiency

Clean Transit

Affordable & Sustainable Housing

Training & Workforce Development

Remediation and Reduction of Legacy Pollution

Development of Critical Clean Water & Wastewater Infrastructure
Reference table categorizing CVI indicators
Use this table to identify a CVI indicator you would like to explore, then type its name into the “Search for an indicator” search box.
Climate Change
Public Health Impacts
- Temperature-related mortality
- Deaths from climate disasters
- Increased PM2.5 mortality – CVD (ages 65+)
- Increased Ozone mortality (all ages)
- Increase in childhood asthma incidence
- Aedes albopictus dengue transmission increase
- Aedes aegypti zika transmission increase
- Aedes aegypti dengue transmission increase
- Surface PM2.5
Property
- Flooding risk to properties
- Wildfire risk to properties
- Property taxes expected to be lost by 2045 due to chronic inundation
Weather Trends
- Cold Wave – Annualized Frequency
- Days with maximum temperature above 35°C
- Days with maximum temperature above 40°C
- Maximum of maximum temperatures
- Mean temperature
- Urban Heat Island Extreme Heat Days
- Winter Weather – Annualized Frequency
- Snowfall
- Frost Days
- Consecutive Dry Days
- Standardized Precip Index
- Total Precipitation
Flooding and Sea Level
- Coastal Flooding – Annualized Frequency
- Riverine Flooding – Annualized Frequency
- Sea Level Rise
Economics
- FEMA Hazard Mitigation Grants
- Cost of climate disasters
- High-Risk Jobs Productivity (% Change)
- Yields (% change)
- Expected Annual Loss – Agriculture Value
- Expected Annual Loss – Building Value
- Expected Annual Loss – Population Equivalence
- Residential Energy Expenditures (% change)
- Share of Jobs in Agriculture
Affordable & Sustainable Housing
Housing Types
- Multi-Unit Structures
- Group Quarters
- Mobile Homes
Housing risks
- Housing Foreclosure Risk
- Percent of Housing Units Built Between 1940-1969 as of 2015-2019
- Crowding
Clean Energy & Efficiency
Residential Energy
- Residential Energy Cost Burden
- Residential Energy Expenditures (%Δ)
Energy Emissions
- State Energy-related Carbon Dioxide Emissions by Year
- Share of Energy from Fossil Fuels
Training & Workforce Development
Risks to workers
- Outdoor Workers – Work Days at Risk per Year
Remediation and Reduction of Legacy Pollution
Harmful exposures
- Agricultural Pesticides
- Stream Toxicity Risk- Screening Environmental Indicators (RSEI)
- Black Carbon
- Pollution Sources
- Lead Paint: % Housing Units Built Before 1960 per Census Tract
- Lead in Drinking Water Violations
Waste Sites
- Metal Recyclers
- Hazardous Waste Management Facilities (TSDFs)
- Hazardous Waste Generators/Incinerators
- Landfills
Dangerous Sites
- Superfund Sites
- Brownfields
- Proximity to Facilities Participating in Air Markets
- National Priorities List (NPL) sites
- Facilities with Enforcement or Violation
- Toxic Substances Control Act (TSCA) Facilities
- Risk Management Plan Facilities
- Chemical Manufacturers
- Active Oil and Gas Wells
Development of Clean Water & Wastewater Infrastructure
Clean Water and Wastewater
- Indoor Plumbing
- Lead in Drinking Water Violations
Flooding and Sea Level
- Coastal Flooding – Annualized Frequency
- Riverine Flooding – Annualized Frequency
- Flooding Risk to Roads
- Flooding Risk to Properties
- Sea Level Rise
Clean Transit
Transportation Access
- Housing Type & Transportation
- Transportation Sources
- National Transportation Noise Map
- Transportation
- No Vehicle
- Walkability
- Bikability
Transit Infrastructure
- Delay (congestion) per capita/census tract
- Flooding risk to roads
- Lane miles per capita
- Road Quality and Maintenance
- Bridge Quality and Maintenance
- Public Transit Performance
Learn more about Justice40 and other grant funding opportunities in the Resources section of this website.
Using the CVI to Apply for Justice40 Funding
Once you have selected relevant CVI indicator(s) for a specific grant funding application and/or advocacy initiative, follow the same steps to explore the data as detailed above for the Overall Climate Vulnerability data.
How to use selected indicators
Step 1: Pick a location
Enter an address, street, neighborhood, zip code, city, or county in the search bar to find your community. You can also locate your state or EPA Region in the Geographic Context. This location should correspond to the targeted location for your grant funding application at the census tract or county level.
Step 2: Pick an indicator
Find an indicator(s) that you would like to use in your grant funding application by identifying it in the table or by searching for it using the Indicator Navigation search box on the main page or summary page.

Step 3: Generate a report
Click the “View Report” box on the bottom right to view a summary report of data at your location. You can view demographic information on the left and indicator score percentile and ranking on the right.
Step 4: Explore the data
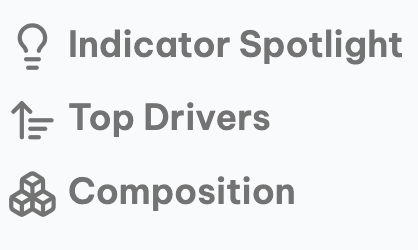
Explore more information by clicking “Indicator Spotlight” on the left or scrolling down on the right. You can now see how your location compares to others by looking at the national percentile and ranking for that indicator.
You can click “Top Drivers” to see the rank and percentile of the distribution of vulnerabilities in the Community Baseline and Climate Impacts categories. This contains valuable information about what is driving vulnerability in your selected location.
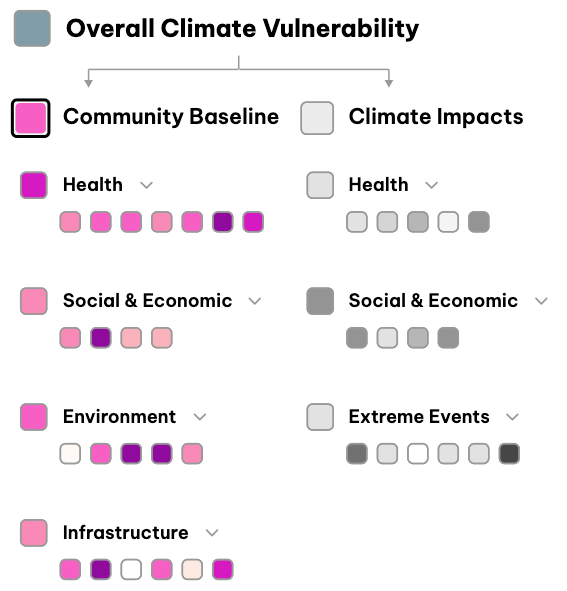
Click “Composition” to see a summary of Community Baseline data, including its percentile, vulnerability rating, and ranking of other locations at that scale, as well as the percentiles for other data categories within the Community Baseline theme.
Note: Not all indicators have “Top Drivers” and “Composition” available.
Step 5: Export
Export this information by selecting “Print” on the upper lefthand corner. Repeat the above steps for any indicators relevant to a grant funding application. You may now directly use this information in your grant funding application.
Additional Justice40 Grant Writing Resources
Justice40 grant funding databases:
- Equitable & Just National Climate Platform Funding Finder
- Justice40 Accelerator
- Inflation Reduction Act (IRA) Tracker


