


U.S. Climate Vulnerability Indicator Selection
We utilized a broad range of sources, including existing literature, other screening tools, academic, non-profit, and government collaborators with subject-matter expertise, and input from community stakeholders to identify potential indicators to include in the U.S. Climate Vulnerability Index (CVI). From the onset, we purposefully engaged environmental justice community-based organization leaders with whom we had existing working relationships and held periodic meetings for over one year to ensure essential indicators relevant for community advocacy were included. Community stakeholders requested inclusion of data reflecting sources of population susceptibility, long-standing inequity in the neighborhoods they serve, and known areas needing fundamental structural investment based on daily lived experience.
Indicators were sought across two main themes: Baseline vulnerabilities and Climate Change risks (Figure 1). Each category was further divided into subcategories reflecting more detailed aggregations of indicators.
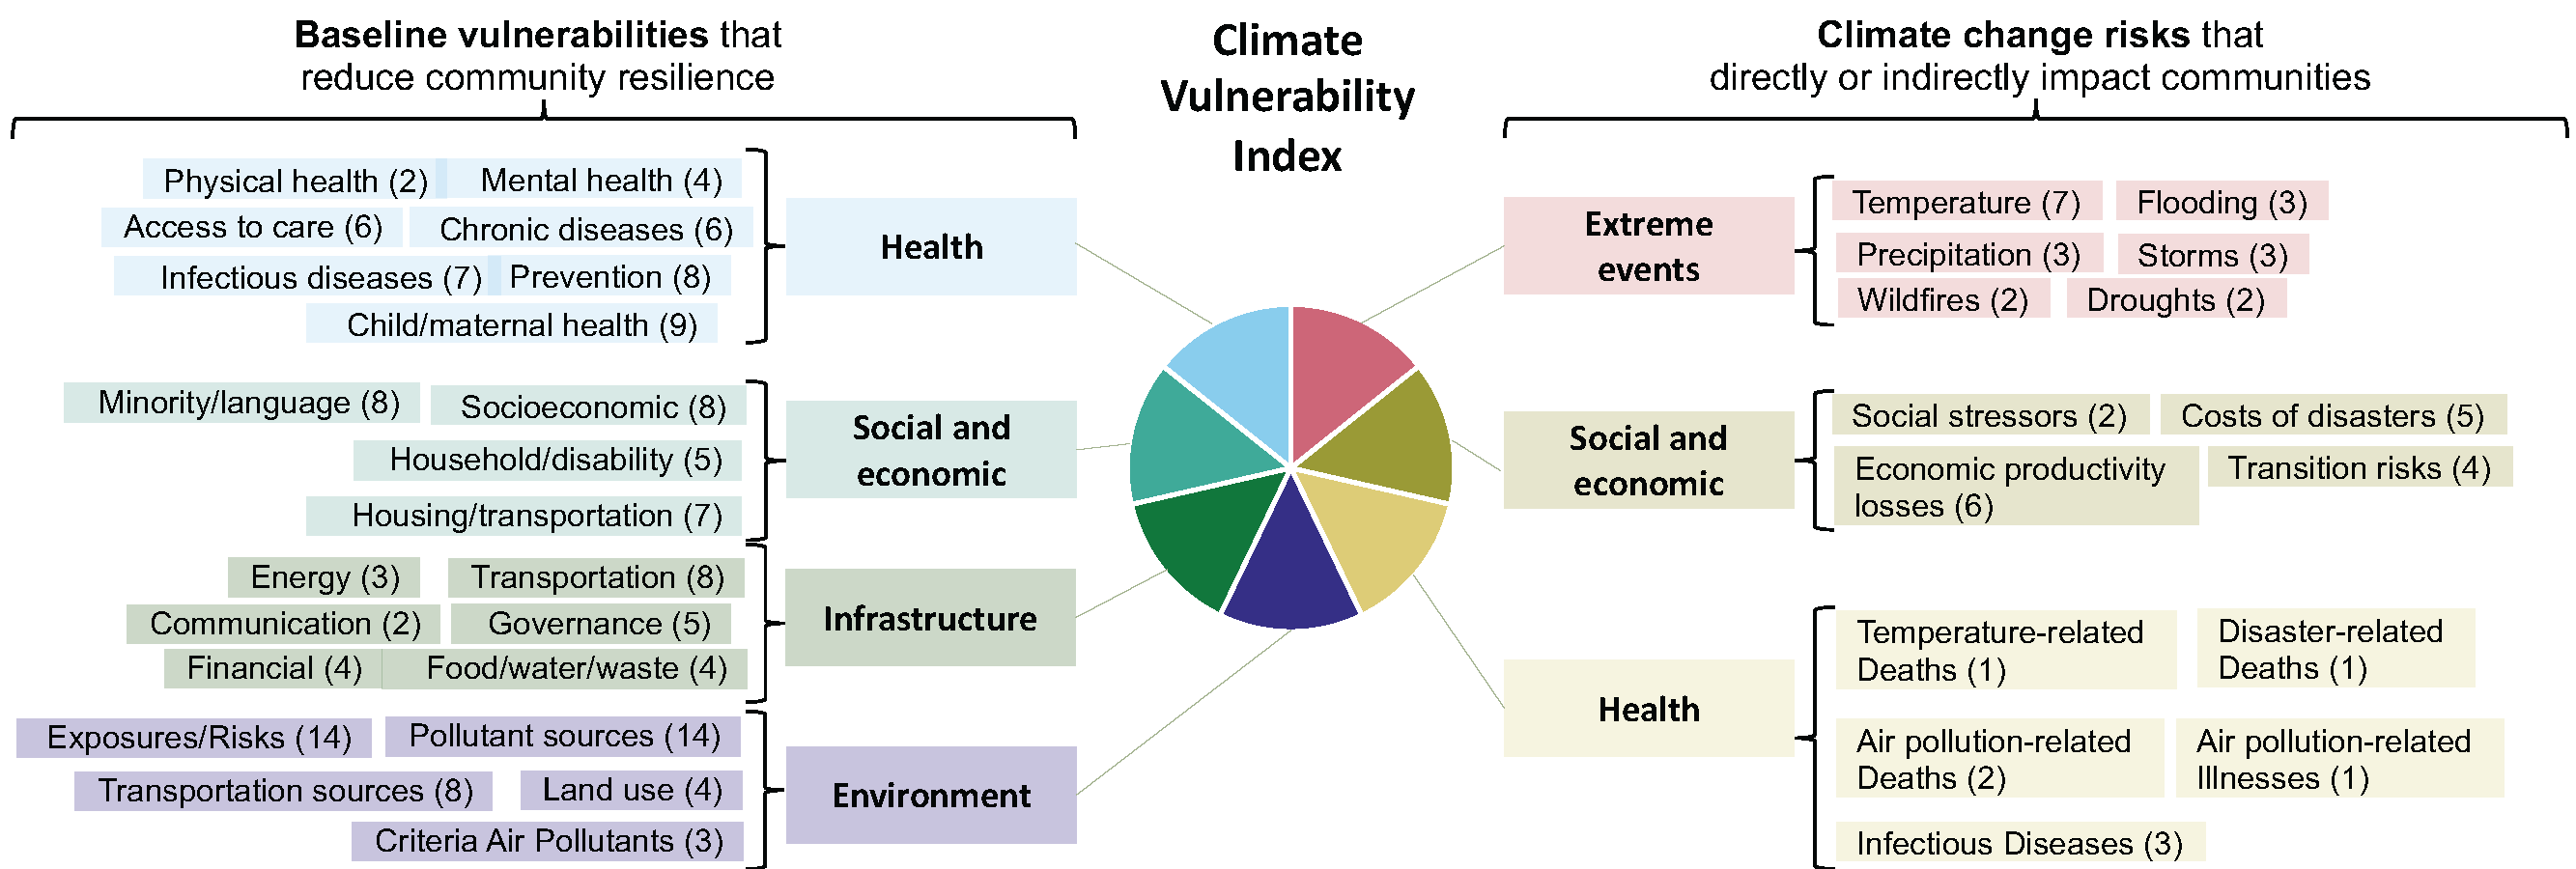
Figure 1: Vulnerability and risk categories (n=7) and components (n=37) used to create the U.S. Climate Vulnerability Index. One or more indicators (n in parentheses) are aggregated into each component (outermost boxes), which are then combined into individual vulnerability and risk categories (inner boxes), and finally into the overall U.S. Climate Vulnerability Index (center).
Baseline vulnerability indicators reflect factors that may reduce resilience or are potential sources of long-standing community inequity or injustice. These were divided into four categories: Health, Social & Economic, Infrastructure, and Environment.
- The Baseline Health domain addresses differences in prevalence of chronic and infectious diseases, access to care, maternal and child health, mental health, life expectancy, and preventive care.
- The Baseline Social & Economic domain leverages the U.S. Centers for Disease Control and Prevention and Agency for Toxic Substances and Disease Registry Social Vulnerability Index but is augmented by indicators such as redlining designations in urban areas, additional vulnerable populations (e.g., homeless, veterans), crime and prison statistics, housing characteristics, and presence/lack of non-governmental organizations.
- The Baseline Infrastructure domain incorporates transportation, energy, food, water and waste management, governance, access to physical, digital, and financial resources factors.
- The Baseline Environmental domain includes indicators that characterize long-standing disparities of environmental exposure stressors and pollution, such as transportation, area and point sources generating air, soil, and water pollution, land use, and environmental health risk metrics.
Climate Change risks reflect both direct and indirect impacts, and were divided into three risk categories: Health, Social & Economic, and Extreme Events. Indicators included both historical data and projections.
- Health risks domain associated with climate change included health projections of climate-related infectious disease and morbidity and mortality related to temperature, disasters, and pollution.
- Social & Economic risk domain of climate change include indicators reflecting exacerbation of social stressors, property impacts, economic and productivity losses, energy transition, and greenhouse gas emissions.
- The Extreme Events domain encompasses increased frequency and/or severity of natural disasters and weather extremes.
Data Sources
We evaluated more than 200 datasets for inclusion in the CVI. Of these, we prioritized publicly available, nationally consistent (all 50 U.S. states and the District of Columbia) data with census tract-level geographic resolution with the most recently released dataset. To not double-count data, we excluded existing index scores as these are typically composites of many datasets. To avoid pandemic-related anomalies, we predominantly obtained annual data from 2017-2019.
The final list of 184 indicators and datasets is provided in an Excel spreadsheet.
We used census tracts as the geographical unit of observation, which have an average population of about 4,000 people, due to abundance of data at this scale. Finer resolution (census block group or block level) data may suffer from unacceptable levels of uncertainty or censoring of data due to privacy issues (Ravichandran V. 2021). Census tracts also allow for sufficient granularity to understand hyperlocal differences within urban areas whereas county level data is too broad to identify drivers of vulnerability and where targeted benefits and resources should be directed. However, when census tract level data were unavailable, we utilized county- or state-level data. For these limited datasets, all census tracts within the geographic area were assigned the same value.
Datasets were evaluated for completeness, distribution, and variability in observations. We excluded datasets where there was a preponderance of missing data or were virtually uniform across census tracts. Notably, several national datasets (n=9) lacked Alaska and Hawaii data. These datasets were not excluded, as metrics for 48 contiguous states were available. Instead, values for Alaska and Hawaii were left missing and did not contribute to the CVI index score for those states. The paucity of datasets that included U.S. territories precluded our ability to include them in CVI.
U.S. Census 2010 Tigerline shapefiles (U.S. Census Bureau 2010) were used to define geographic boundaries as most datasets have not yet been updated using 2020 census tracts. Additionally, because we relied primarily on pre-pandemic era data, we wanted to avoid spatial or temporal misclassification by utilizing 2020 census boundaries. In total, there are 73,057 census tracts and 3,221 counties for all 50 U.S. states and the District of Columbia. We note the 2010 boundaries simply define the geographic areas and not timing of data collection. For a small number of transportation datasets that were only available on 2020 census boundaries, we used a U.S. Census Bureau recommended crosswalk to reassign 2020 bounded data to 2010 geographic areas (U.S. Census Bureau 2022).
Data Processing
Data obtained in GIS format were converted to comma separated value (csv) files using ESRI ArcGIS so they could be integrated with other datasets to create the CVI score. For raster datasets, pixels falling within tract boundaries (polygons) were averaged to assign a single value per tract.
Where a small fraction of data were missing, it was imputed with the median at the next larger geographic scale (i.e., for missing census tracts, the median of non-missing census tracts within a county was assigned). No more than 25% of data were imputed, and all but 10 indicators had less than 5% imputed. Additionally, where appropriate, population- or area-based adjustments were made to create indicator parameters that were comparable across census tracts (e.g., case counts converted to per capita). All data were converted to percentiles so a single scale could be used to integrate disparate data sources. For consistency in directional uniformity, with higher percentiles reflecting greater vulnerability or risk, some indicator percentiles were inverted. For example, lower life expectancy in years had a higher percentile value indicating greater vulnerability. All indicators within and across category domains were evaluated to assess redundancy. Certain types of indicators required additional pre-processing and described in further detail in Tee Lewis et al. (2023).
Data Integration
To integrate data across multiple data streams, we adapted the Toxicological Prioritization Index (ToxPI) approach (Marvel et al. 2018; Reif et al. 2013; Bhandari et al. 2020), which has been used extensively to communicate risk prioritization and profiling information. ToxPI utilizes a weighted average to aggregate data to provide an overall relative aggregated score. We utilized a hierarchical structure where subcategory scores are built from individual indicators, category ToxPI scores are built from subcategories, and the overall CVI score is built using category ToxPI scores. Each indicator, sub-domain, and domain were equally weighted at each aggregation level. For online visualization, ToxPI scores were converted to percentiles from 0 – 100, where higher values indicate greater vulnerability.
For further information
Additional details as to the methodology and underlying data sources can be found in the publication:
P. Grace Tee Lewis, Weihsueh A. Chiu, Ellu Nasser, Jeremy Proville, Aurora Barone, Cloelle Danforth, Bumsik Kim, Jolanda Prozzi, Elena Craft. Characterizing vulnerabilities to climate change across the United States, Environment International, Volume 172, 2023, 107772, ISSN 0160-4120. https://doi.org/10.1016/j.envint.2023.107772.
All data can be accessed from the GitHub found at: https://github.com/wachiuphd/CVI


